













He never changes your data quietly
Cleaning is proposed, not applied.
- Every step comes with the row count it affects
- Nothing runs until you accept it
- Cleaning happens on a copy; your sources are read-only
Programs designed with the cost per outcome right, before the budget locks.
Find out what people will actually do, before you build for what you assumed.
Purpose-built systems that work on the ground, not only on the dashboard.
Field operations that turn a plan on paper into work on the ground.

Impact intelligence for the people who run programmes. Ask any question about your programmes in plain English and watch it turn into live reports. Ben, your personal AI analyst, watches them around the clock and tells you what deserves your attention.
30 days free · No credit card · Free training session
No formula bar, no aggregation dropdown, no join diagram. You type a sentence; Ben picks the chart, writes the query, groups the dates and puts it on your report.
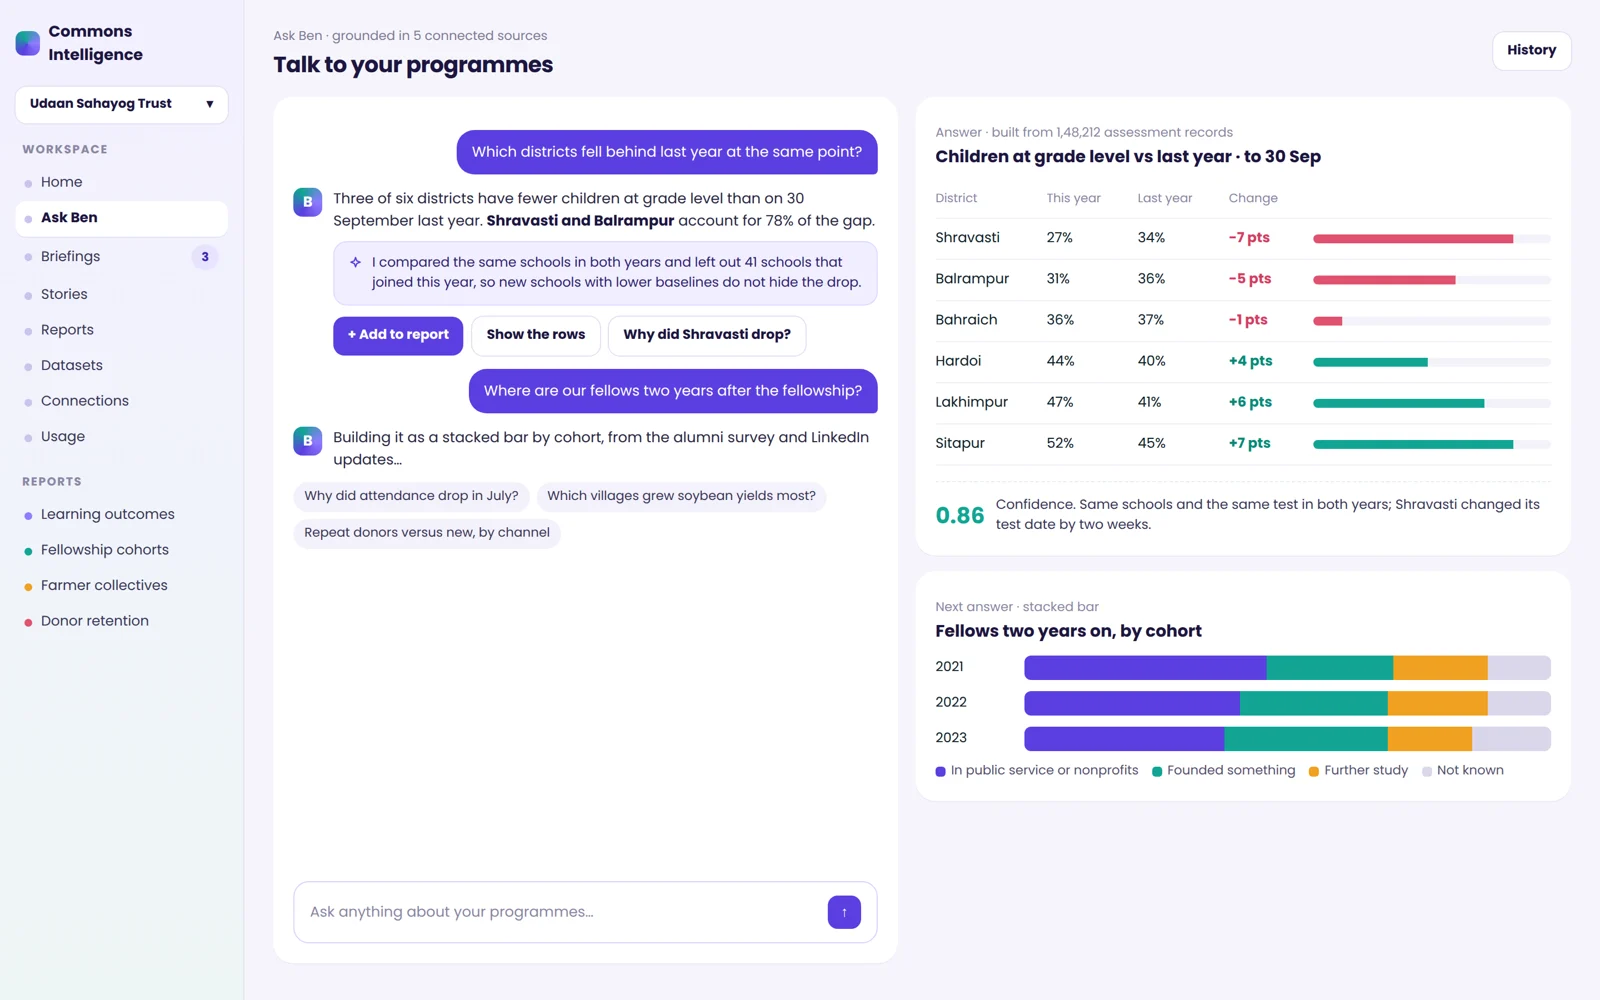
The reporting layer answers the questions you ask. The intelligence layer tells you what you did not think to ask, and it runs whether or not anybody opens it.
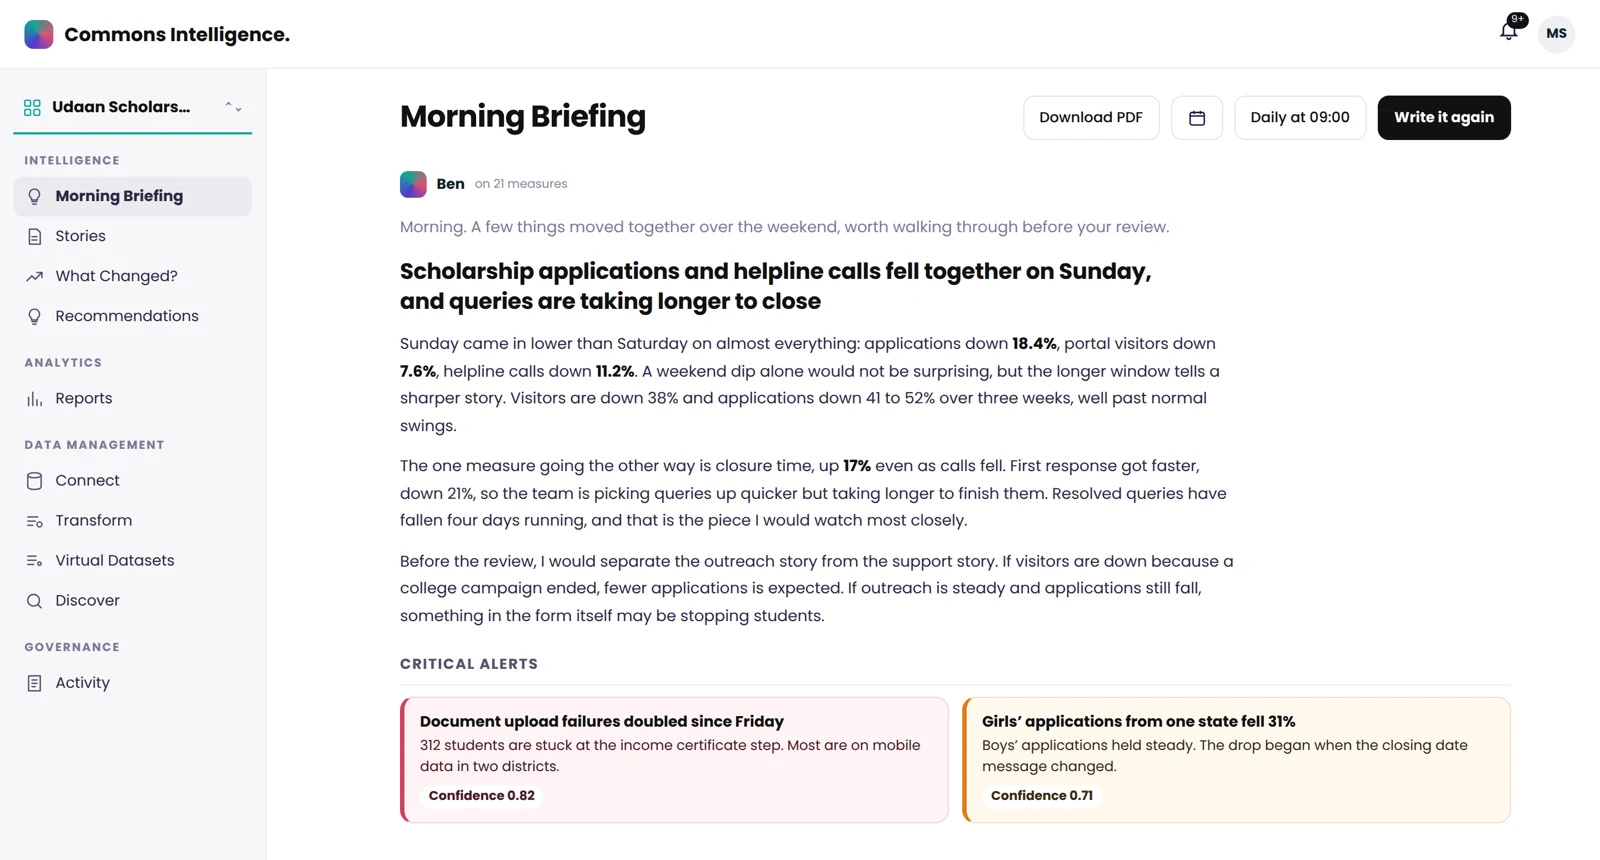
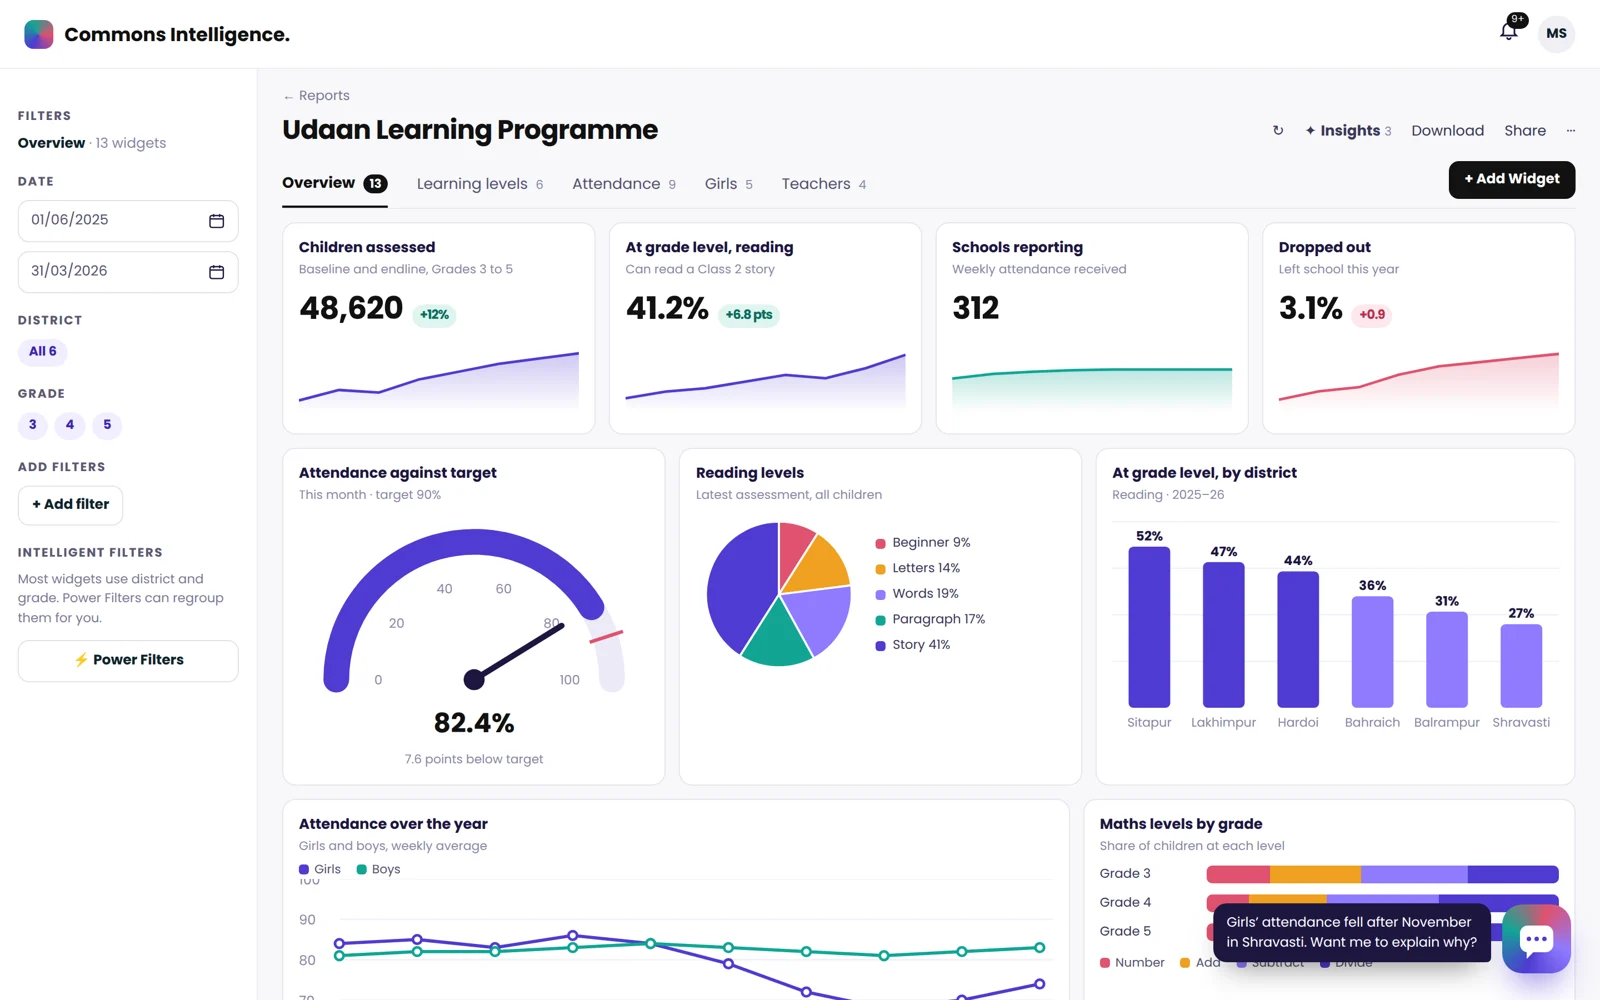
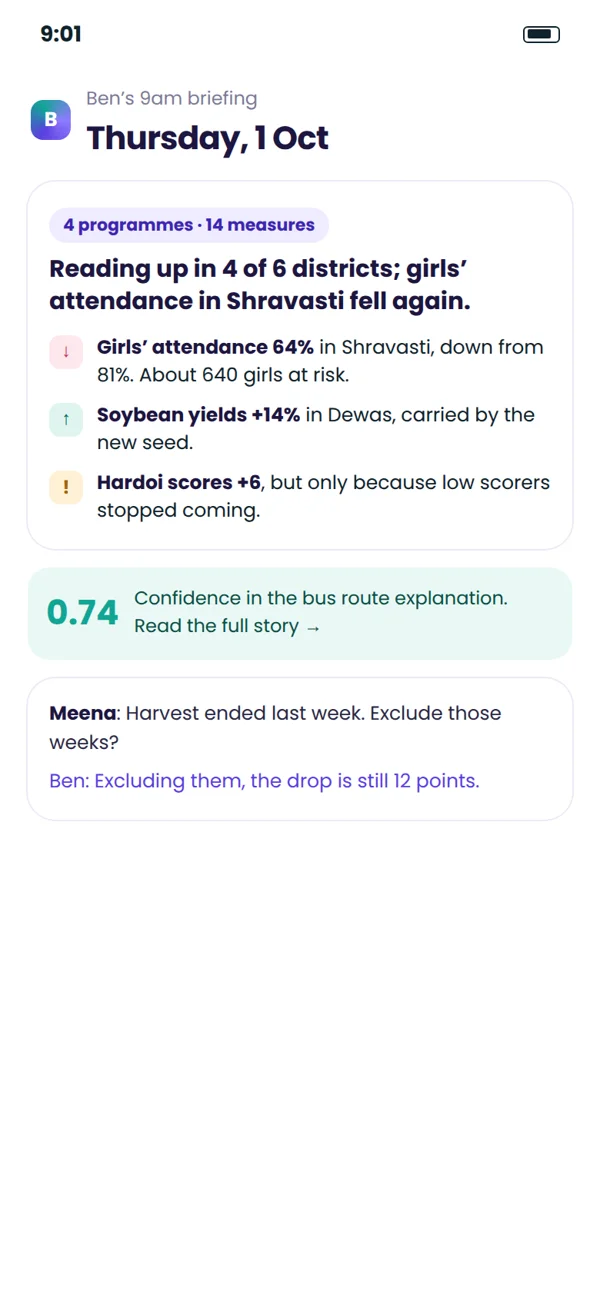
The report on the desk, and the morning briefing wherever you open it.
Ben is your personal AI analyst. He runs on a schedule, not on a button: a briefing every morning, a story when something specific happens, and a recommendation you can argue with.
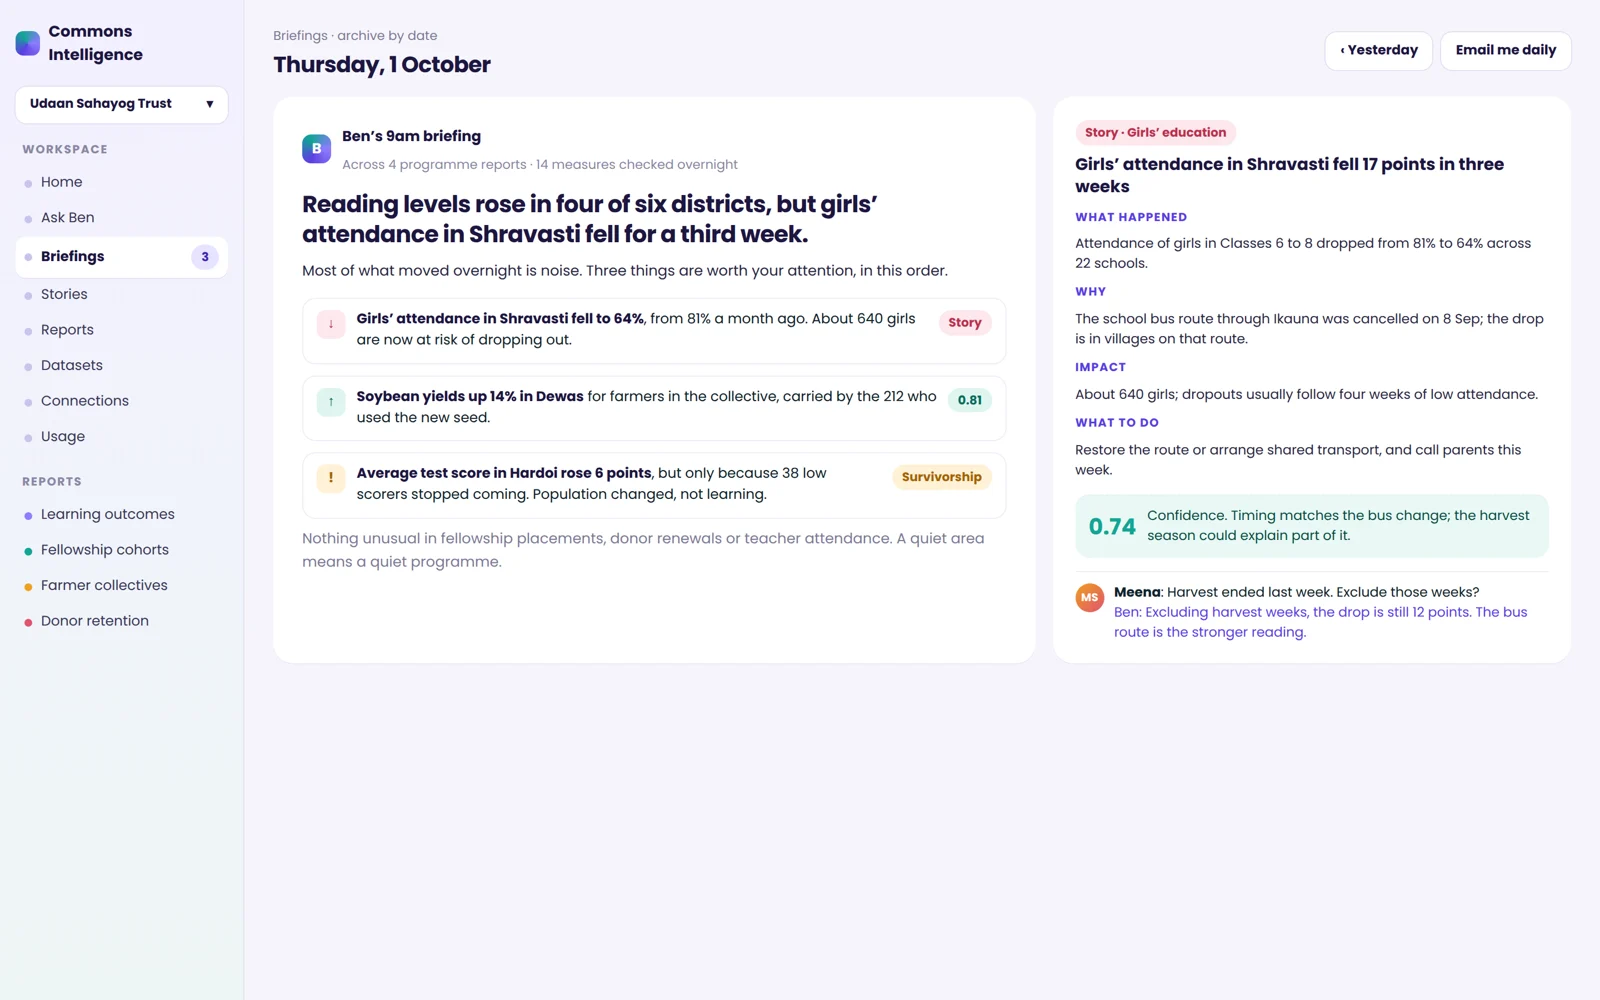
An analyst you cannot check is an analyst you cannot use. Each of these is a property of how it is built, not a promise about how careful we are.
Cleaning is proposed, not applied.
A score, and the sentence it rests on.
A quiet feed means a quiet programme.
The model gets the shape, not the contents.
How it works
The part that normally needs a data engineer happens in four steps, with no SQL, and your raw data is never modified.
Analytics, spreadsheets, databases, field tools and uploads. Tick the tables; pick a refresh.
Ben lines up columns across systems and proposes the fixes. You approve. It stays in sync by itself.
Describe what you want, or take the controls. Thirty-plus chart types, no SQL either way.
Briefings, stories, changes and recommendations arrive without anyone pressing anything.
Thirty years of reporting across these fields went into how he reads them: the metrics that matter, the ones that mislead, and the trap each sector falls into.
Enrolment, attendance, learning outcomes and who is falling behind.
Plots, seasons, yields and prices, with the weather in the picture.
Emissions, energy and restoration, measured over years not quarters.
Coverage, outcomes, follow-up and where care is dropping off.
Recruitment, retention, programme health and the hours behind them.
Applications, selection, cohorts and what fellows do afterwards.
Campaigns, donors, repeat giving and what each channel really costs.
Many systems, many teams, one version of the numbers.
Commons Intelligence sits on top of your systems rather than replacing them, and everything it produces exports as PDF, Excel, CSV or through a documented API.
Passwords, SSH keys and tokens are encrypted with AES-256-GCM before storage. No endpoint returns them.
Cleaning happens on a copy in a separate layer. Your source systems are never written to.
Separation is physical, not a column in a shared table.
Roles per entity and per action: view, create, update, delete.
What ran, when, how long it took and what it changed, including failed runs.
Self-host the whole thing, or run in our cloud with a dedicated database of your own.
Founders and programme heads need the number now, and need to know whether to believe it.

Channel, cohort and retention analysis usually takes an analyst and a fortnight.
The monthly pack should be assembled and current, not rebuilt every month.

Your analyst spends the week on requests that a sentence could answer.

Leaders should not have to open ten reports to learn what changed.

A drop matters only if you know why, and what to do next.

Data collected on phones in the field should turn into something a funder will read.
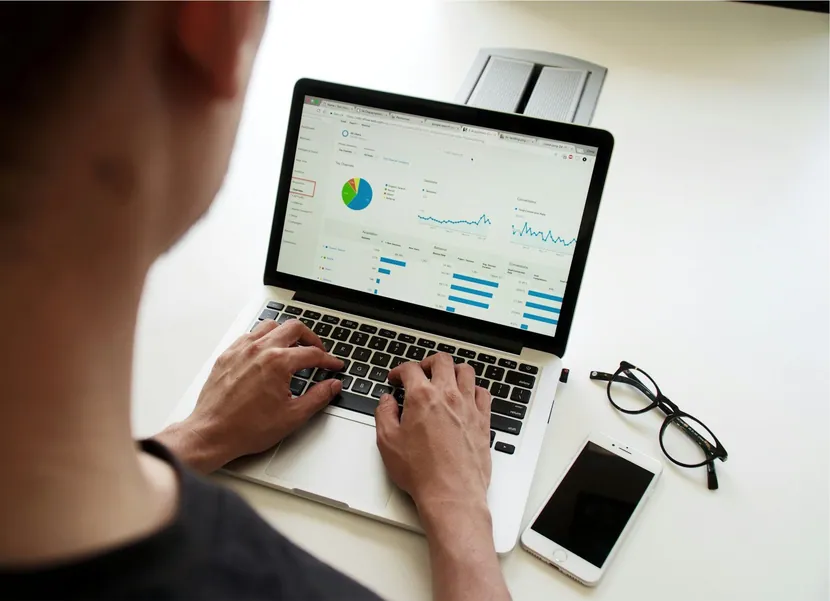
Programme teams run on five tools and a spreadsheet.
Your numbers live in databases, spreadsheets and apps that do not talk.

Messy spellings, mixed dates and duplicates usually need a data engineer.

Plots, seasons, yields and prices, with the weather in the picture.
Funders want outcomes, not activity counts.
Four things every team asks for first.
Analytics, spreadsheets, databases, field tools and uploads.
Columns lined up and fixes proposed. You approve.
Thirty-plus chart types, no SQL either way.
What changed, why, and what to do, without pressing anything.
Not the person who owns the database. The person who owns the number.
01The number now, and whether to believe it.
02Data from five tools joined without an engineer.
03The monthly pack, current and traceable.
04Channels, cohorts and retention in minutes.
05Field data turned into something a funder will read.
 Quality Education
 Decent Work and Economic Growth
 Industry, Innovation and Infrastructure
 Reduced Inequalities
 Partnerships for the Goals
Every feature
Every plan has every feature, including the free month.
Ask
Ben picks the chart type, writes the query and groups the dates.
Answers grounded in the same rows the charts are drawing.
Save it to the report in one click.
A starter report of twenty widgets, organised into tabs, from your connected data.
Ideas based on the columns you actually have.
A plain-language brief on an undocumented database.
Intelligence
Measured against each metric’s own normal range.
When a total moves, which segment carried it, named and quantified.
Said first when an average improves because the population changed.
What to do and why, with the argument shown.
A score and the sentence it rests on.
Briefings and stories kept by date, so you can read back through a quarter.
Reporting
Several systems in one report, joined and kept consistent.
Describe how to slice the report and every widget follows.
Every figure opens onto the rows behind it.
Mark the campaign, outage or launch on the timeline.
The exception is visible without reading every row.
Password-protected links, PDF, Excel and image export.
Data transformation
Ben lines up columns that mean the same thing.
dim_ord_dt becomes order_date, and you can overrule it.
Spellings, dates and currencies fixed with row counts shown.
“I found 342 duplicate students”, with the rule it used.
A join that would double-count children stops and asks you.
Everything rebuilds on schedule; renamed columns are flagged.
Connectors and charts
Google Analytics, Google Sheets, MySQL and CSV upload.
Shopify, Stripe, Salesforce, HubSpot, Zoho, PostgreSQL, Snowflake, BigQuery, CommCare, SurveyCTO.
Better Together and Campus Cloud: programmes, partners, cohorts and placements.
Bars, lines, maps down to Indian districts, funnels, Sankey, pivots and KPIs.
Grains, rolling windows, period compare and forecasts with a visible band.
Lakhs and crores or millions, with currency and date formats per field.
How the AI is used
Every prompt carries a sample and the real values being discussed.
Counts and deviations are computed in code; the model explains.
Matches, fixes and recommendations wait for your Accept.
Findings say whether the model or the built-in rules wrote them.
If the AI service is down, the rules-based path answers.
See exactly where every token went.
Pieces of the product teams open every day.
312
Active in 18 states
48,620
Open any one to see it in the product.
Reports, briefings, stories and clean datasets in one place.
Describe a chart and Ben adds it, with his assumptions shown.
Questions answered from your own rows, with a confidence score.
48,620
What moved, why it matters and what to do, every morning.
Join systems, fix messy values and rebuild automatically.
318
will sync on Wi-Fi
Briefings and shared reports read well on a phone.
48,620
318
will sync on Wi-Fi
I used to walk into the board meeting with a number I could not defend. Now the chart opens onto the rows it was drawn from.
My queue of ad-hoc requests emptied in a fortnight. I spend the week on the analysis that actually needs a person.
The survivorship warning stopped us claiming a gain that was really a change in who we were measuring.
Fifteen connectors and counting. Point it at your own warehouse, or use ours and move later. Everything exports as PDF, Excel, CSV or through a documented API.

Start free for a month. No card, no sales call, and a free training session. Pay annually and save 20%.
One person getting a proper handle on their own numbers
₹1,999/ month
A team building reporting together, with real AI headroom
₹4,999/ month
Many teams, many sources, and data that has to stay where you put it
Custom
“Tell us how your programme runs today. We will show you the product on your own workflow, and be honest about whether it fits.”
A reporting tool with an AI analyst built in. Connect your systems, ask questions in plain English, and let Ben send you a briefing every morning about what changed and what to do.
Pick a plan to keep going. There is no card on file during the trial, so if you do nothing, nothing is charged.
No. The model gets the shape of your tables and a small sample of rows. Counts and calculations are done in code, and credentials are never shared.
Yes. On Enterprise you can bring your own Anthropic key, run your own warehouse engine, or self-host the whole platform.
Yes; we stay through launch until your team runs it.
The number now, and whether to believe it, before the next funder meeting.
Five tools and a spreadsheet, joined without a data engineer.
The monthly pack, assembled and current, every figure traceable.
Channel, cohort and retention analysis without the fortnight wait.
Building charts, reading reports, cleaning data and running queries cost nothing. Tokens go only when the model is actually called, and your plan's monthly allowance comes first.
Top up any amount; what you do not use stays on your balance.
A morning briefing or a full story, a few thousand. Matching the columns of two tables, a couple of thousand. A one-line question, a few hundred.
Ben stops before your allowance runs out and says so. Topping up is your decision, not a surprise on the invoice.
Put in your own Anthropic key and the intelligence runs on your contract, at your rates. Every call is still itemised.
“Reporting tells you what happened. Ben tells you what to do, and shows you why.*”
“commons stayed through the messy months after launch, training our team and fixing what the field broke, until the system genuinely ran without them.*”
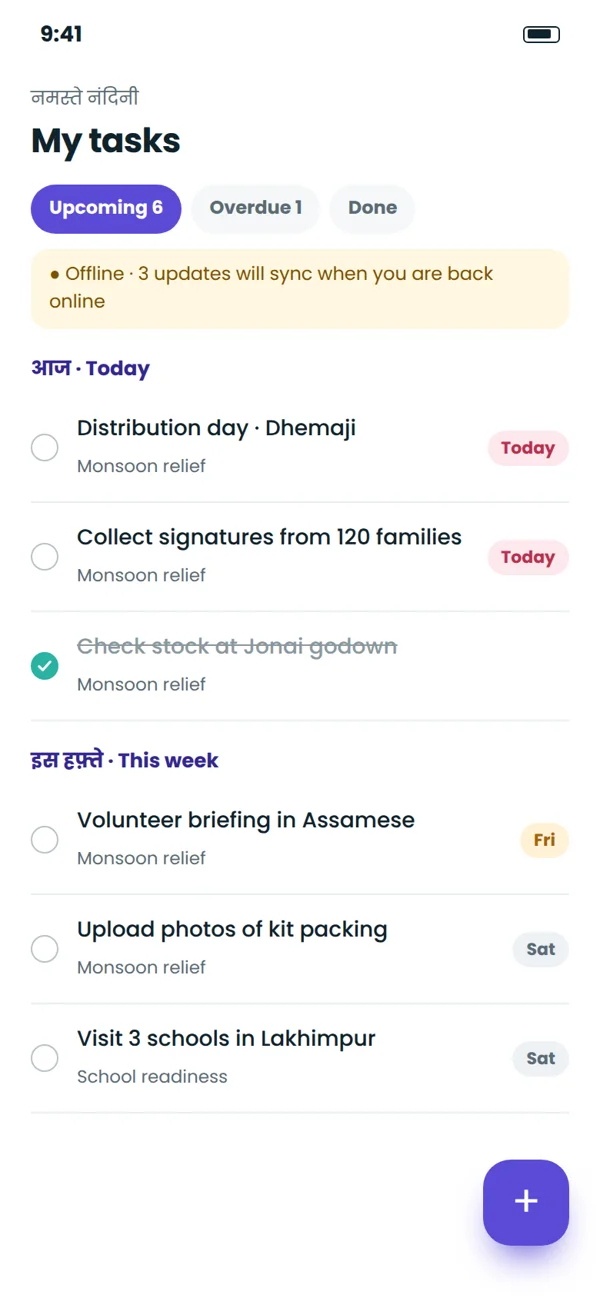
Project management for nonprofits: organise teams, volunteers and partners into projects and tasks, with lists, boards, timelines, portfolios, goals and a field app that works offline.

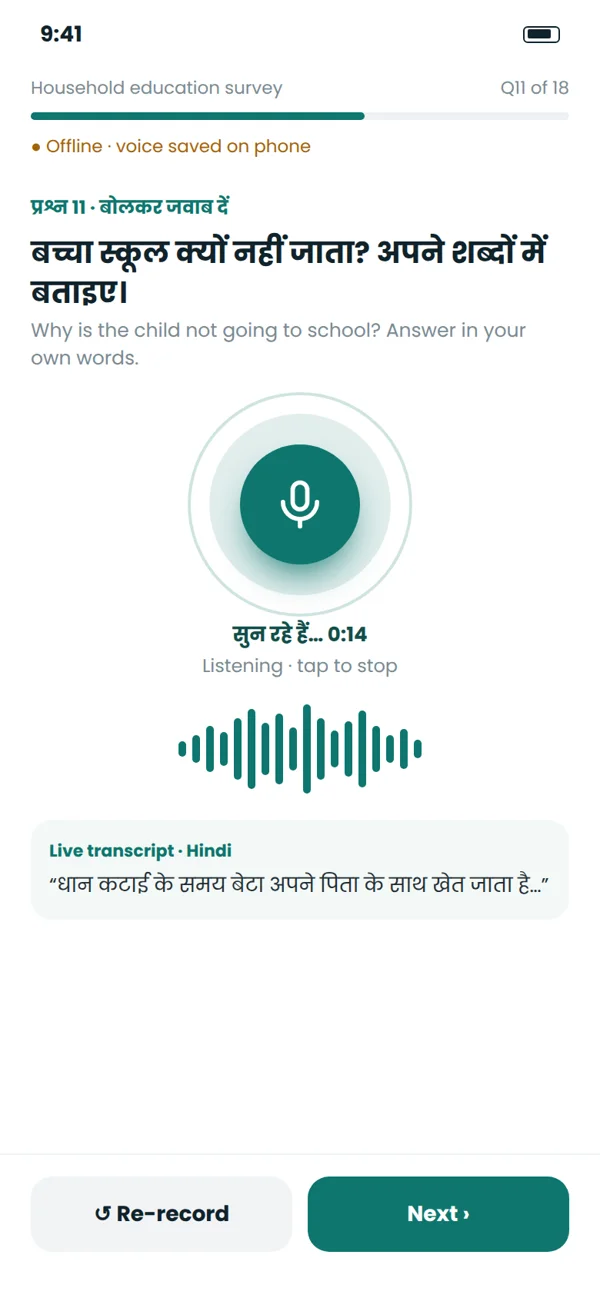
Surveys for the social sector: build in minutes, collect on web, WhatsApp and an Android app that works offline, check quality as answers arrive.

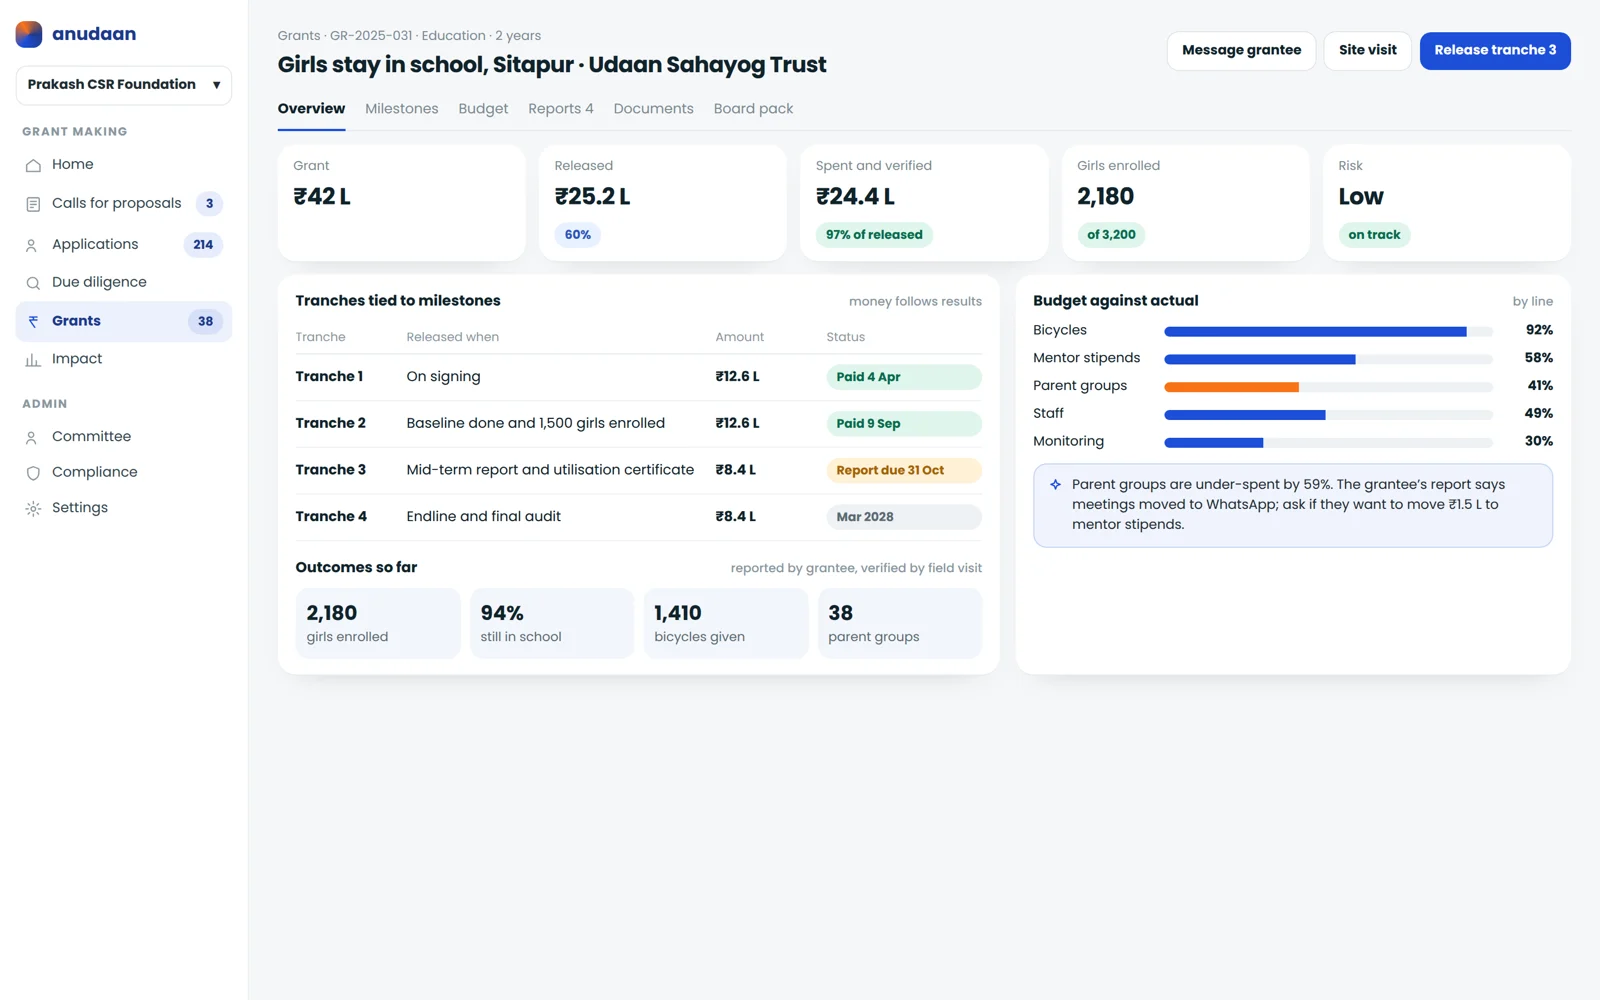
Grant management for grant makers and grant seekers: calls for proposals, AI review, due diligence, milestone tranches and reports, plus an AI proposal writer for nonprofits.
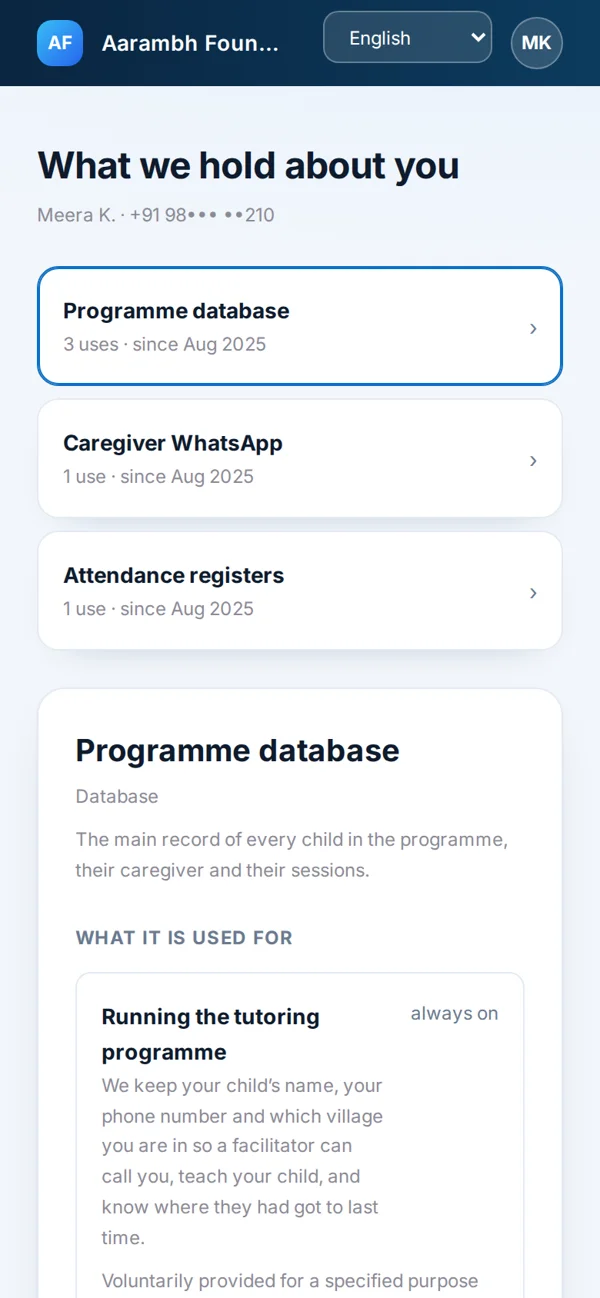
DPDP compliance and consent management for nonprofits: multilingual notices, purpose-wise consent, parental consent, rights requests, data map, retention and breach response.